 Random Thoughts
I always look at the charts first. Then, if I notice what appears to be a loss of momentum on a “net net” basis, I will plot moving averages to further confirm what I’m seeing. Indicators don’t indicate. They illustrate. They help to show what’s already there. The S&P is now trading below its Bowtie moving averages (10 simple, 20 exponential, and 30 exponential—available in virtually all charting packages) and those moving averages are beginning to turn town (which btw, happens automatically soon after price crosses through).
I ran a scan for downtrend proper order on the Bowtie moving averages in the Ps. Nearly half (48.4%) have already crossed over and are now in downtrend proper order (10sma<20ema<30ema). There’s nothing magical about a moving average—or any other “indicator” for that matter-but they can help to keep you on the right side of a market.
Because moving averages have lag, I also ran a “Daylight” scan to see if stocks have recently moved above or below the moving average. This helps to reduce the lag associated with waiting for a crossover. Looking for those stocks with Tuesday’s high below the 30-day ema, I found that nearly 60% of the stocks in the Ps have Daylight below their 30-day ema. Ditto for the 20 ema.
I also ran all of the above on the broader based Rusty (IWM) and the numbers well over 60%
So what does this mean? Well, statistics are worthless. 75.4% of all people know that. However, in addition to good ole fashion “eyeballing” the chart, they can help to confirm what you are seeing or make you look a little further.
It means that momentum has slowed and the internals have weakened. You can do all of the above or, as I preach, just look at where the market is today and look back a few days, weeks, months. Doing this, the S&P has now gone 3-months without any forward progress.
Way back in April I had very similar concerns but the market decided to go up regardless. Do your homework but never forget that the market can do whatever it wants.
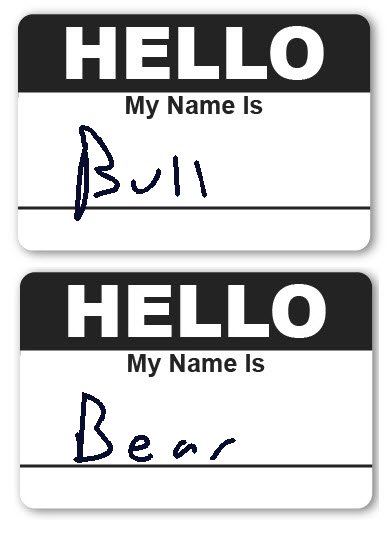
Don’t be a bull. Don’t be a bear. Be aware.
Looking to the scoreboard, the Ps ended down around ¼%. This is no big deal but based on all the aforementioned pontification, they have obviously lost some momentum.
The Quack (Nasdaq) only lost about ¼% too. Again, no big deal but the Bowtie moving averages are on the cusp of crossing over. This is significant since this shift in momentum is from decade plus highs.
Those who have grown comfortable with the nice uptrend in the major indices might be forced to face reality when the perpetual upward climb ends.
The Rusty (IWM) remains the dog with the most fleas. It got nailed for just over 1 ½%. We are now closing in on nearly 1-year of flat to negative performance. This is more indicative of the broader market internals.
Both Gold the commodity and Gold stocks hit new lows on Tuesday. They did this in spite of Isis, plagues, and the latest arrest of Michael Phelps and Amanda Bynes. Seriously, this “what me worry” attitude of gold is interesting. Usually there is some sort of flight to safety during uncertain times. We’ll have to keep an eye on this situation. Sometimes it can hint of across-the-board liquidation—somebody needing to raise cash fast. Silver looks even worse. It appears to be in a free fall. Someday, we will see the mother of all bottoms in the precious metals. In the meantime, we wait.
My concern in the sectors is that many are rolling over from high levels and could Bowtie down soon. I’ll flesh this out in a lot of detail in Thursday’s chart show.
So what do we do? Be super selective on the long side. Ask yourself, does this potential stock have the ability to defy gravity? If it doesn’t look like the greatest thing since sliced bread (is slice bread really that great? I dunno, give me a poboy made with crunchy French bread–the kind where you have to be careful not to inhale a large crumb–any day), then pass. Do continue to keep an eye out for a short or two. Don’t get too aggressive just yet. Since the market has been a little sideways, just make sure you really like the setup here too. And, as usual, let stops take you out of existing positions and entries put you in (or keep you out) of new ones.
Best of luck with your trading today!
Dave
Free Articles, Videos, Webinars, and more....