Random Thoughts
For reference, the following was written in September of 2015.
Ron Griess of Thechartstore.com recently published some research on the so-called Death Cross (50-day moving average crossing below the 200-day moving average) in the American Association of Professional Technical Analysts forum. He looked at where a market was 1,2,3,6 months and 1-year after the signals. My initial takeaway (post 1930, read further) from this was that with a few exceptions, markets are usually okay in time. This prompted me to do some research on what happens in between.
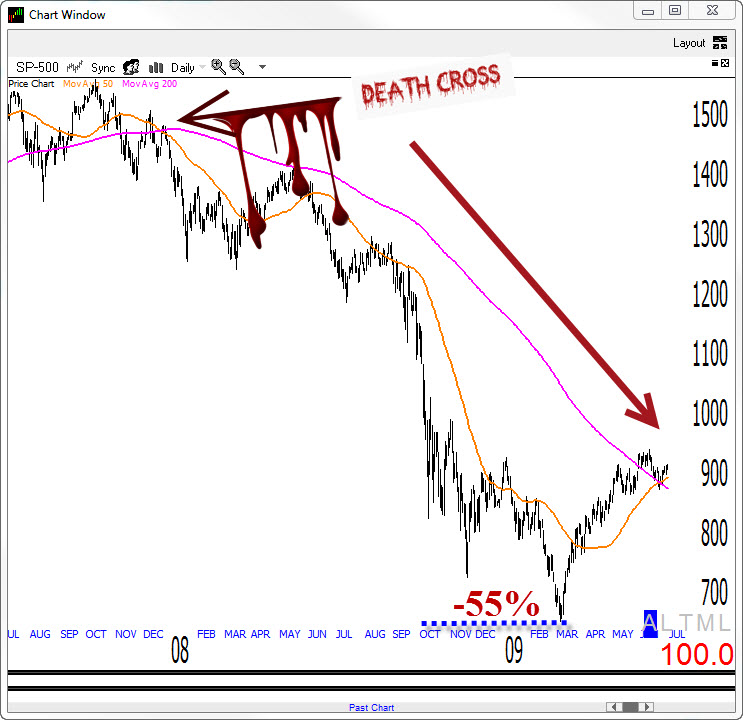
I wondered what the maximum low of the move would be until the moving averages crossed back over–the so called “Golden Cross.” For example in 2007, one of those aforementioned “exceptions,” the moving averages (death) crossed on 12/21. From crossing close to the low of 2009, the Ps (S&P 500) dropped 55%.
When you look at the “in between,” things begin to look a little worse. In 2000, the max move lower was 45%. In 1969 the market basis the Ps dropped nearly 30% before beginning to recover. Since my readily available data in the Ps only went back to 1960, I used the Dow for years prior (Ron went back to the 30s).
Going back to the early 1900s, there was quite a few significant market slides after the cross and before recovering. There were several 20, 30, and 40 percent drops. And, as you would imagine, the worst fall came after the 1929 top where the Dow lost 81%. It did recover, it just took 30-something years. I’m fighting the urge at this moment to go into a why buy and hold doesn’t work diatribe but I guess I already did that in Layman’s.
As my disclaimer, stolen from Greg Morris states, “All predictions are about the future..and, a lot of stuff can happen between now and then.” It’s what happens “in between” that’s important.
Watch Thursday’s chart show for more on the above and for some pretty decent setups mentioned—you guys and gals are getting pretty good! High-five-ah!
So, Is THE Signal Important Or Not?
My recent epiphany that "Everything works better with trend comes to mind." Media-hyped stuff like the Death Cross (or even my stuff such as Bowties) work well when the trend ensues. Trend change signals are important and should not be taken lightly. However, there are no guarantees and sure things when it comes to the market.
Take note of the signals such as the Death Cross and Bowties but never forget to look at price first and foremost. Predictions are tough, especially about the future. (Yogi) What we do know is that the market has broken down from its range. And, it’ll likely have a hard time getting back through that range—the so called “overhead supply.” There’s nothing magical about my approach to technical analysis. I just use charts to help determine the psychology of the market. It’s just human nature. Those people who bought in the range will likely be looking to get out at breakeven.
Speaking Of Ranges
Someone posed an interesting question in the chart show yesterday. They asked, ' How do I know that everyone hasn’t already sold? ' The quick answer is that you don’t. The longer answer is that people, in general, are slow to act. They tend to hold on to hope. After all, the market "always comes back-sarcasm implied. I can be a little sarcastic. In fact, sarcasm is my second favorite “asm.” My first? Enthusiasm! Of course!
On the institutional side, there could be some selling left too. As an example, one of my peeps (thanks Phil!) brought up the fact that over 5,000 institutions own Apple. I doubt seriously that all have unloaded it already. Unloading a large portfolio is like steering a battleship. It doesn’t happen instantaneously.
Best of luck with your trading today!
Dave


