One Big Caveat
By Dave Landry | Uncategorized
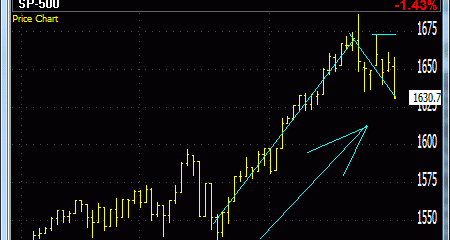
 The market got hit fairly hard on Friday.
Last Tuesday’s high remains the inflection point for the Trend Pivot Pullback (from my book 10 Best Patterns and Strategies). Email me if you need the pattern. If that high gets taken out decisively then it would suggests that the trend is resuming. If you are looking to gain exposure to the overall market via index ETFs, then wait until that high gets taking out.
Most sectors, like the overall market, remain in uptrends.
There is some weakness out there though. With the bonds sliding, interest rate sensitive areas such as Real Estate and Utilities continue to implode. Some other areas such as the Energies, Telecom and Foreign stocks have lost momentum too.
Again, as long as most sectors and the overall market remain in uptrends, I’m going to continue to err on the buy side. The big caveat is waiting for entries. As I preach, that, in and of itself, might keep you out of new trouble. No tick, no trade.
So what do we do? Even with Friday’s weakness, the plan still remains the same. Continue to look to add on the long side. At the risk of preaching (after all, I am lead pastor at www.thechurchoftrendfollowing.com), make sure you wait for entries. If the stock doesn’t go up (to trigger), then don’t buy it. On existing positions you know the routine: take partial profits as offered and honor/trail your stops higher.
Futures are flat to firm pre-market.
Best of luck with your trading today!
Dave

